Software engineering
The energy that is consumed by computing is dependent on several factors. At the largest scales, the statistics show that some elements are effectively carbon neutral. These include the processing performed in data centres operated by major service providers and data transmission over networks in certain countries. A lot of research and development effort is being spent on improvements to hardware design, infrastructure performance and data transparency. Taking a systems view though, it should be clear that reducing the carbon footprint is not the responsibility of isolated actors within the overall computing industry. Rather it is a collective responsibility in which every role has a contribution to make. Otherwise, efforts to optimise energy use in one area could be undermined by an irresponsible use of resources elsewhere. It is therefore important to consider the role of the software engineer in controlling the energy used by applications.

Sustainable software engineering (SSE) is starting to recognised as a coherent subject area that particularly addresses the role of the software engineer taking into account all of the dimensions discussed in these notes. Microsoft publishes one of the clearest articulations of SSE which defines eight principles that correspond to the top level of the hierarchy shown in Fig. 1. They are
present_to_all
- Carbon: Build applications that are carbon efficient
- Electricity: Build applications that are energy efficient
- Carbon Intensity: Consume electricity with the lowest carbon intensity
- Embodied Carbon: Build applications that are hardware efficient
- Energy Proportionality: Maximize the energy efficiency of hardware
- Networking: Reduce the amount of data and distance it must travel across the network.
- Demand Shaping: Build carbon-aware applications
- Optimization: Focus on step-by-step optimizations that increase the overall carbon efficiency
While high-level principles have their place and help to define the overall goals that we are trying to achieve. We need a little more detail before they can be put into practice. The second hierarchical layer in Fig. 1 concerns patterns which are re-usable approaches to solving a particular type of problem. At the lowest level are practices which represent the implementation of patterns in a specific vendor environment or on a particular technical platform. The patterns discussed below would need further refinement to apply then to a particular context.
At the level of day-to-day coding, the software engineer is constantly making decisions. Some of them are structural and concern the overall architecture of the system; others are much more to do with the implementation of specific code. The implications of these decisions for energy efficiency are discussed below.
Architecture
At the highest level of system design, there are some major decisions to make about the overall structure of the application. The largest applications are specifically designed for very large numbers of concurrent users and therefore need to use a distributed architecture of some kind. There are many standard architectural patterns to choose from including the traditional layered approach and event-based systems right through to cloud-native containerised microservices. Simform provide a brief summary of some of the more common architectural patterns.
As well as criteria such as availability, reliability and ease of maintenance, systems architects also consider efficiency and cost when selecting an appropriate strategy. While the primary goal from a traditional point of view is to minimise costs and risks for the operator of the system, these are also the key criteria for minimising energy use. We already know, for example, that making use of cloud services can minimise the overall energy used in computation, but with a potential trade-off in terms of the increased data transmission requirements.
Minimising data transmission volumes is a major goal for distributed systems in order to reduce their carbon footprint. Several of the design patterns described by the Green Software Foundation are based on this idea.
Algorithms
In the same way that there is a correspondence between energy consumed and carbon emissions, the execution time of a programme is also closely linked to the energy it needs to run. Controlling the execution time therefore effectively equates to controlling emissions.
Many resource-intensive tasks are those that operate on a list of values. In such cases, the number of low-level operations (such as comparing two values) can be described in relation to the length of the list. For example, the code snippet below implements a simple technique for finding the largest value in a list of integers. Line 2 creates a list of 20 random integers between 0 and 1000 and then the loop checks every number in the list once. The number of operations is proportional to the length of the list and therefore the execution time scales linearly with the length of the list.
present_to_all
1 2 3 4 5 6 7 8 | |
Another simple task might be to find duplicate values in a list. This is implemented by the code snippet below which contains a nested loop. Because the inner loop traverses the whole list for each iteration of the outer loop, the execution time is proportional to the square of the length of the list.
present_to_all
1 2 3 4 5 6 | |
The formal way to express the relationship between execution time and the length of the input is Big O notation. The table below shows the most common complexities using Big O.
| Big O | Complexity | Description | Example |
|---|---|---|---|
| O(1) | Constant | Constant | Finding the first element of a list can be performed in constant time regardless of the size of the list |
| O(log n) | Logarithmic | Proportional to the logarithm of the size of the input | In a binary search, the search space is halved at each step |
| O(n log n) | Log-linear | Proportional to the size of the input multiplied by its logarithm | Merge sort algorithm |
| O(n) | Linear | Proportional to the size of the input | Finding the maximum value |
| O(n2) | Quadratic | Proportional to the square of the size of the input | Finding duplicate values |
| O(2n) | Exponential | Execution time grows exponentially with the size of the input | Brute force password cracking - ie checking every character possibility in every position |
Sorting a list of numbers into ascending order is a classic problem and many different algorithms exist for achieving the desired outcome. Each algorithm takes a different approach and a theoretical complexity can be calculated for each one. However, the best way to understand the different strategies is possibly to use a visualisation. The Sort Visualizer is a good example which provides explanations of each sorting algorithm and example implementations as well as the visualisation itself.
Time complexity of sorting algorithms
The table gives the theoretical complexity of each algorithm. Remember that Big O is an indication of the worst-case performance.
| Algorithm | Time Complexity |
|---|---|
| Bogo Sort | O((n+1)!) |
| Bucket Sort | O(n2) |
| Bubble Sort | O(n2) |
| Count Sort | O(n+k) |
| Cube Sort | O(n log(n)) |
| Gnome Sort | O(n2) |
| Heap Sort | O(n log(n)) |
| Insertion Sort | O(n2) |
| Quick Sort | O(n2) |
| Merge Sort | O(n log(n)) |
| Pigeonhole Sort | O(n+r) where r = range |
| Radix Sort | O(nk) |
| Selection Sort | O(n2) |
| Shell Sort | O(n2) |
| Tim Sort | O(n log (n)) |
| Tree Sort | O(n2) |
Monitoring and measurement
Fundamentally, SSE is an optimisation problem. The goal is to achieve the desired outcomes for a minimum of energy. As a scientific process, this requires measurement of the energy use of a piece of software, ideally taking into account all of its contributing factors such as the source of the electricity it consumes, the carbon embodied in the hardware, the data transmission over the internet and so on. This can be a hugely complex undertaking but fortunately a number of tools and techniques are available to use.
In 2021, Lannelongue et al. (2021) developed a coefficient-based approach to evaluating the carbon footprint of computation. The user provides a set of simple input parameters and the online tool calculates the resulting energy used and the associated carbon emissions.
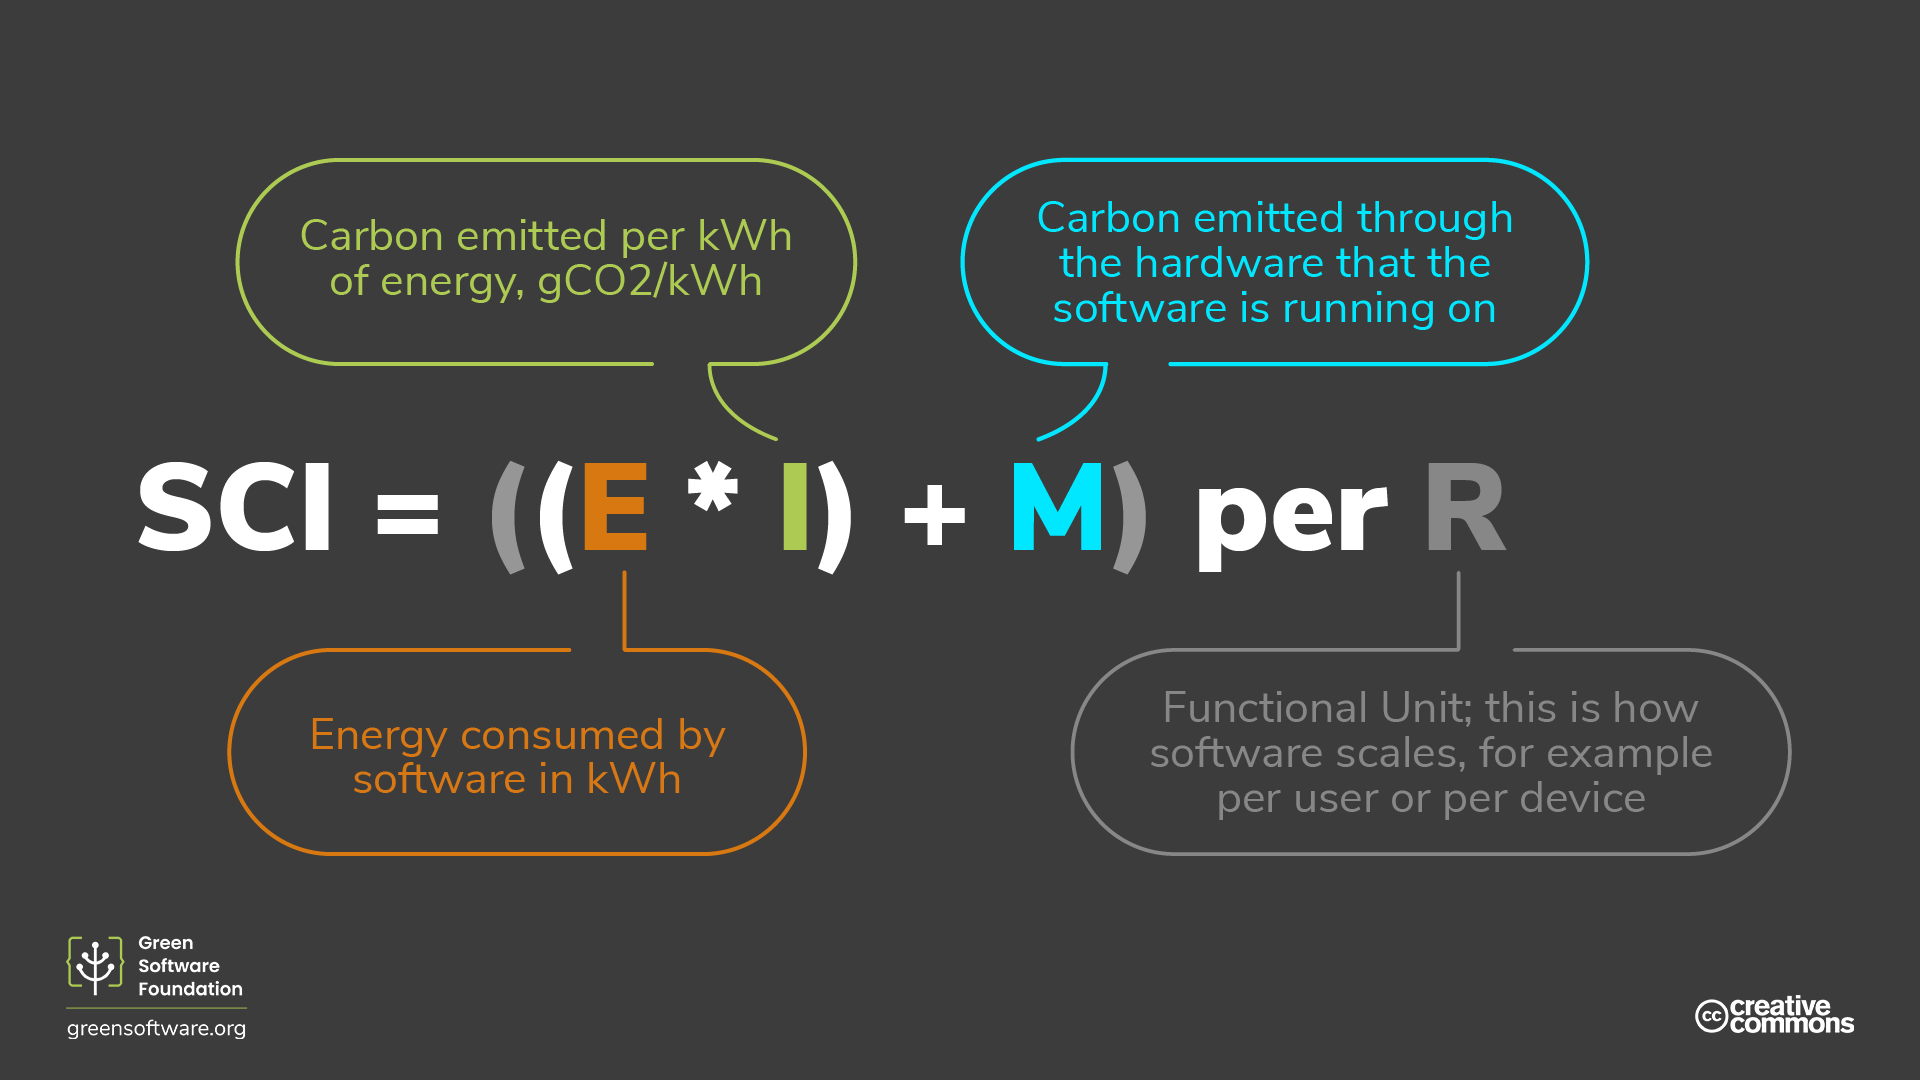
The Green Software Foundation takes a more fine-grained approach in its definition of a Software Carbon Intensity (SCI) metric. The SCI is designed to express the rate of carbon emissions for a software system - comparable to kilometres per litre for a road vehicle. The SCI score is calculated on the basis of the equation in Fig. 2 in which
- E = electrical energy consumed
- I = local carbon intensity
- M = Embodied emissions
- R = Functional unit (e.g API call, page render, etc.)
The SCI method has the benefit of being simple to express at the high level. This makes it easy to compare one system with another. However, like all input-output methods, a lot of detail about the system to feed into the calculation. The recommended process is:
present_to_all
- Bound: Decide on the software boundary; i.e., the components of a software system to include.
- Scale: As the SCI is a rate (carbon emissions per one functional unit), pick the functional unit which best describes how the application scales.
- Define: For each software component listed in the software boundary, decide on the quantification method; real-world measurements, based on telemetry, or lab-based measurements, based on models.
- Quantify: Calculate a rate for every software component. The SCI value of the whole application is the sum of the SCI values for every software component in the system.
- Report: Disclose the SCI score, software boundary, and the calculation methodology.
Notice that the very first step is to define the system boundary. In any complex system, it is always tempting to define that boundary too narrowly so that elements outside the boundary can be ignored.
At the level of a single device or a single piece of software, a range of measurement tools exist that tap into readily-available information from the hardware and the operating system. Intel processors, for example, provide the Running Average Power Limit (RAPL) interface that makes it possible to monitor the power usage of the processor directly. Khan et al. (2018) have shown that RAPL figures correlate well with the plug power of the device and that using RAPL has the advantage of monitoring individual computing cores without external metering equipment.
On Linux systems, the PowerAPI specification provides a framework for building software-based power meters. It allows application developers to draw together readings from the processor's RAPL interface as well as tracking the energy used by running processes. The intention is that a series of power meters for different environments will eventually be developed along the lines of SmartWatts which is designed specifically for containers.
Exercise: Measuring code efficiency
In the exercise below, you will explore some of the utilities available with the python ecosystem for tracking execution time and software carbon footprint.