Energy use
The topic model exercise in an earlier section identified energy usage, data centre management and data communications as major themes in the academic literature. Clearly, the amount of energy used by computing equipment is a major factor in its "greenness". Data centres are of particular interest since they are major concentrations of such equipment, and the energy used by network devices continues to rise as the internet extends to more parts of the world and more devices are connected.
The less energy a device or service uses, the more green and sustainable it is. The majority of effort in the field of green computing therefore goes on finding ways of using energy more efficiently. The first step towards this goal is to understand how and where energy is used in a computing system and this has several beneficial outcomes:
present_to_all
- The scale of the problem can be fully appreciated
- The relative contribution of different components becomes clearer
- The rate and direction of change can be evaluated
- Potential solutions can be evaluated against the current context
The sections below provide a brief exploration of three major aspects of modern computing systems:
present_to_all
- Data centres which are playing an increasingly important role in service delivery
- Communications networks which are responsible for the transmission of data over arbitrarily long geographical distances
- End-user computing which is the most visible aspect of computing for most individuals
In advance of these discussions, the next section sets out some useful terminology.
Embodied and operational carbon
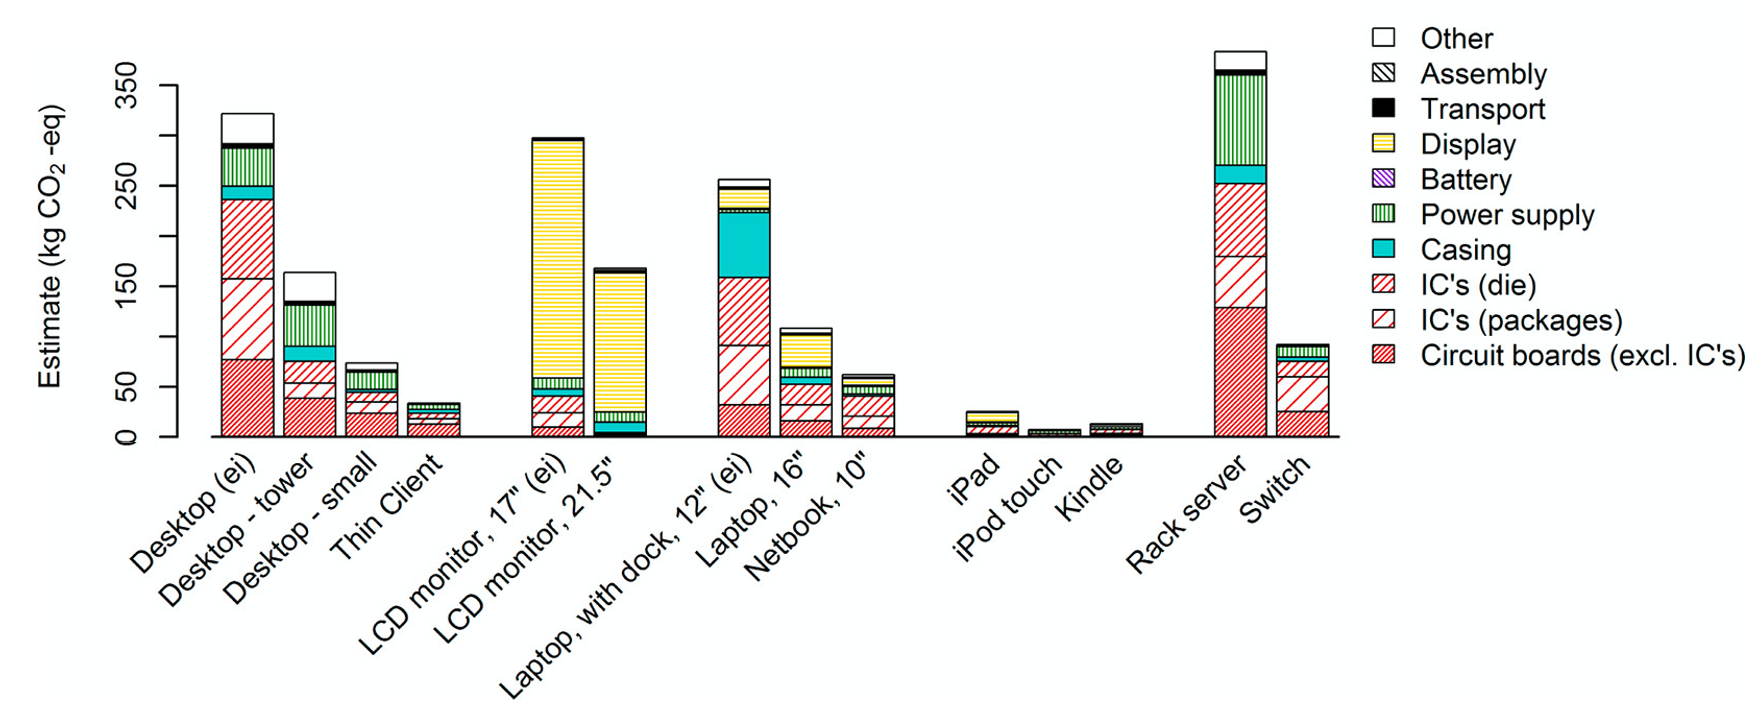
Although the most obvious energy requirement for the operation of a computer system is the electricity it consumes, the computing device itself is the result of a large number of physical processes that themselves consume a great deal of energy. While it is tempting, as discussed in the previous section, to ignore any phenomena outside the immediate context, the full impact of computing activity needs to take this production energy into account even though it is essentially invisible to the end user. This leads to the distinction between operational and embodied carbon. Fig. 1 shows the embodied carbon for a range of common computing devices.
Because the energy required by different physical process takes many forms and comes from various sources, it is useful to have a common unit by which it can be discussed, compared and monitored. The most significant effect of human industrial activity is the rise in global temperatures that is caused by the greenhouse gases (GHG) released into the atmosphere. Carbon dioxide (CO2) is the most abundant and long-lasting GHG and for that reason it has become common practice to represent the energy used by a process in terms of the amount of CO2 that it releases. The emission of GHGs other than CO2 is converted into its CO2 equivalent according to the global warming potential (GWP) or the gas in question.
Global Warming Potential
Although CO2 is the most significant GHG overall, there are other gases that cause more heating per unit. They are described in terms of their Global Warming Potential (GWP) which is defined with reference to CO2. Another term in common use is therefore CO2 equivalent.
Methane (CH4), for example, has a GWP of 28. That is to say that its effect is 28 time stronger than that of CO2. Some gases, such as chlorofluorocarbons (CFCs) and hydrofluorocarbons (HFCs) have GWPs above 1000.
The organisation Greenhouse Gas Protocol publishes GWP values for all known GHGs and also provides a range of calculation tools that can be useful when performing conversions.
The combination of operational and embodied carbon represents the total emissions of a product or service and is referred to as its carbon footprint. Over the last 10 years or so, many carbon footprinting methods and tools have been developed and have become more and more sophisticated. The ACT approach, for example, takes 16 input parameters only one of which, application execution runtime, is exclusively related to the operation of the system.
ACT carbon footprint input parameters
| Parameter | Description | Range |
|---|---|---|
| T | App. execution time | From SW profiling |
| LT | HW lifetime | 1-10 years |
| Nr | Number of ICs | From HW design |
| Kr | IC packaging footprint | 0.15 kg CO2 |
| A | IC Area | From HW design (cm2) |
| p | Process node | 3-28 nm |
| MPA | Procure materials | ∼0.50kg CO2 per cm2 |
| EPA | Fab energy | 0.8-3.5 kWh per cm2 |
| Ciuse | HW CO2 intensity | 30-700 g CO2 per kWh |
| CIfab | Fab CO2 intensity | 30-700 g CO2 per kWh |
| GPA | GHG from fab | 0.1-0.5 kg CO2 per cm2 |
| Y | Fab yield | 0-1 |
| CPA | CO2 from fab | 0.1-0.4 kg CO2 per cm2 |
| EDRAM | DRAM embodied CO2 | 0-0.6 kg CO2 per GB |
| ESSD | SSD embodied CO2 | 0-0.03 kg CO2 per GB |
| EHDD | HDD embodied CO2 | 0-0.12 kg CO2 per GB |
The researchers who developed the ACT model present evidence to show that the efficiency gains in system operation over the last decade have meant a shift away from operational costs towards capital expenditure (capex) costs. Their conclusion is that efforts to reduce the overall carbon footprint of computing should focus on embodied carbon (Gupta, Elgamal, et al., 2022). However, it should be noted that the ACT model does not include an input parameter that represents the energy mix in a particular location. The energy mix describes the proportion of electricity that is generated from renewable and traditional sources. This carbon intensity is different from one country to another as shown by Figs. 2 and 3 which represent France and China respectively
Figure 2: Energy consumption by source: France
Our World in Data
Figure 3: Energy consumption by source: China
Our World in Data
Data centres
With the growth of cloud computing, the data centres that are operated by large technology companies have become an indispensable part of the internet. Companies such as Google, Facebook and Amazon operate worldwide networks of data centres, each one providing the infrastructure needed by thousands of applications and consuming around 70 MW of power (600,000 MWh per year).
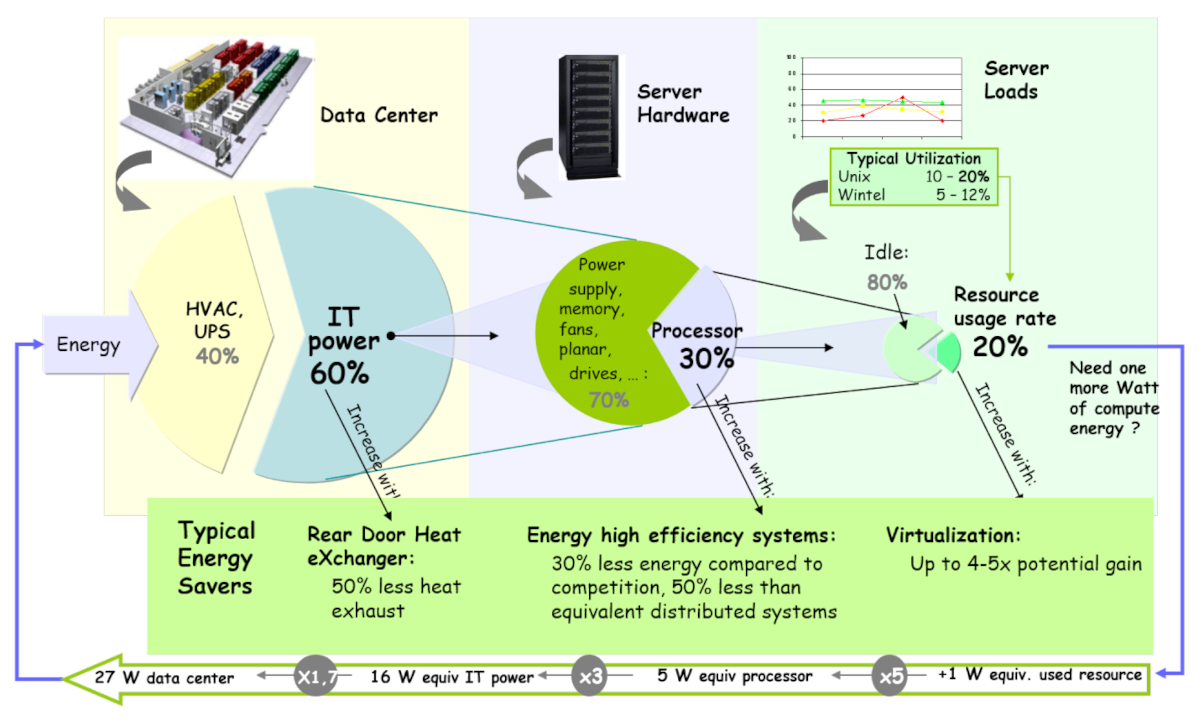
Such large concentrations of machinery generate a large amount of waste heat, and around 40% of a data centre's electricity consumption is required by its cooling systems as illustrated in Fig. 4.
Despite the increasing demand for cloud services, statistics show that the global energy use of data centres is holding more or less steady at around 190 TWh per year because of improvements in operational efficiency. The current statistics shown in Fig. 5 correspond well to the predictions made in 2020 by (Masanet et al., 2020) and run counter to assumptions that the energy requirement of data centres is spiralling out of control. In fact, because data centre operators are all making greater use of renewable sources of electricity, their operational carbon footprint is surprisingly low. This confirms the results presented by (Gupta, Elgamal, et al., 2022).
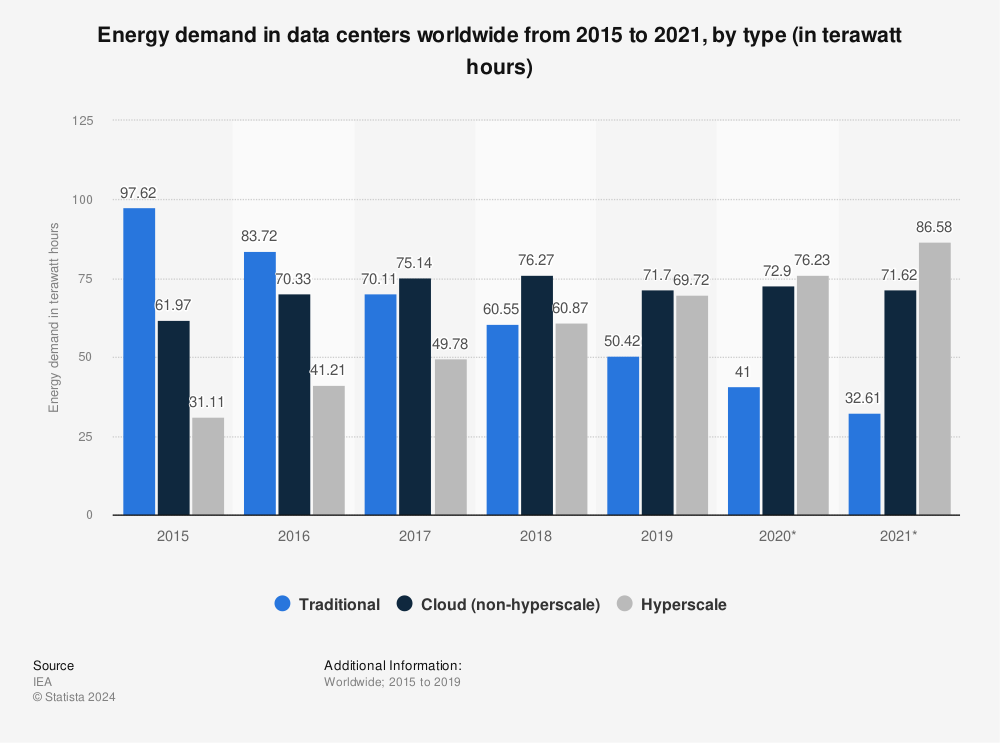
Find more statistics at Statista
Figure 5: Global data centre energy use (Click for interactive version)
Communication networks
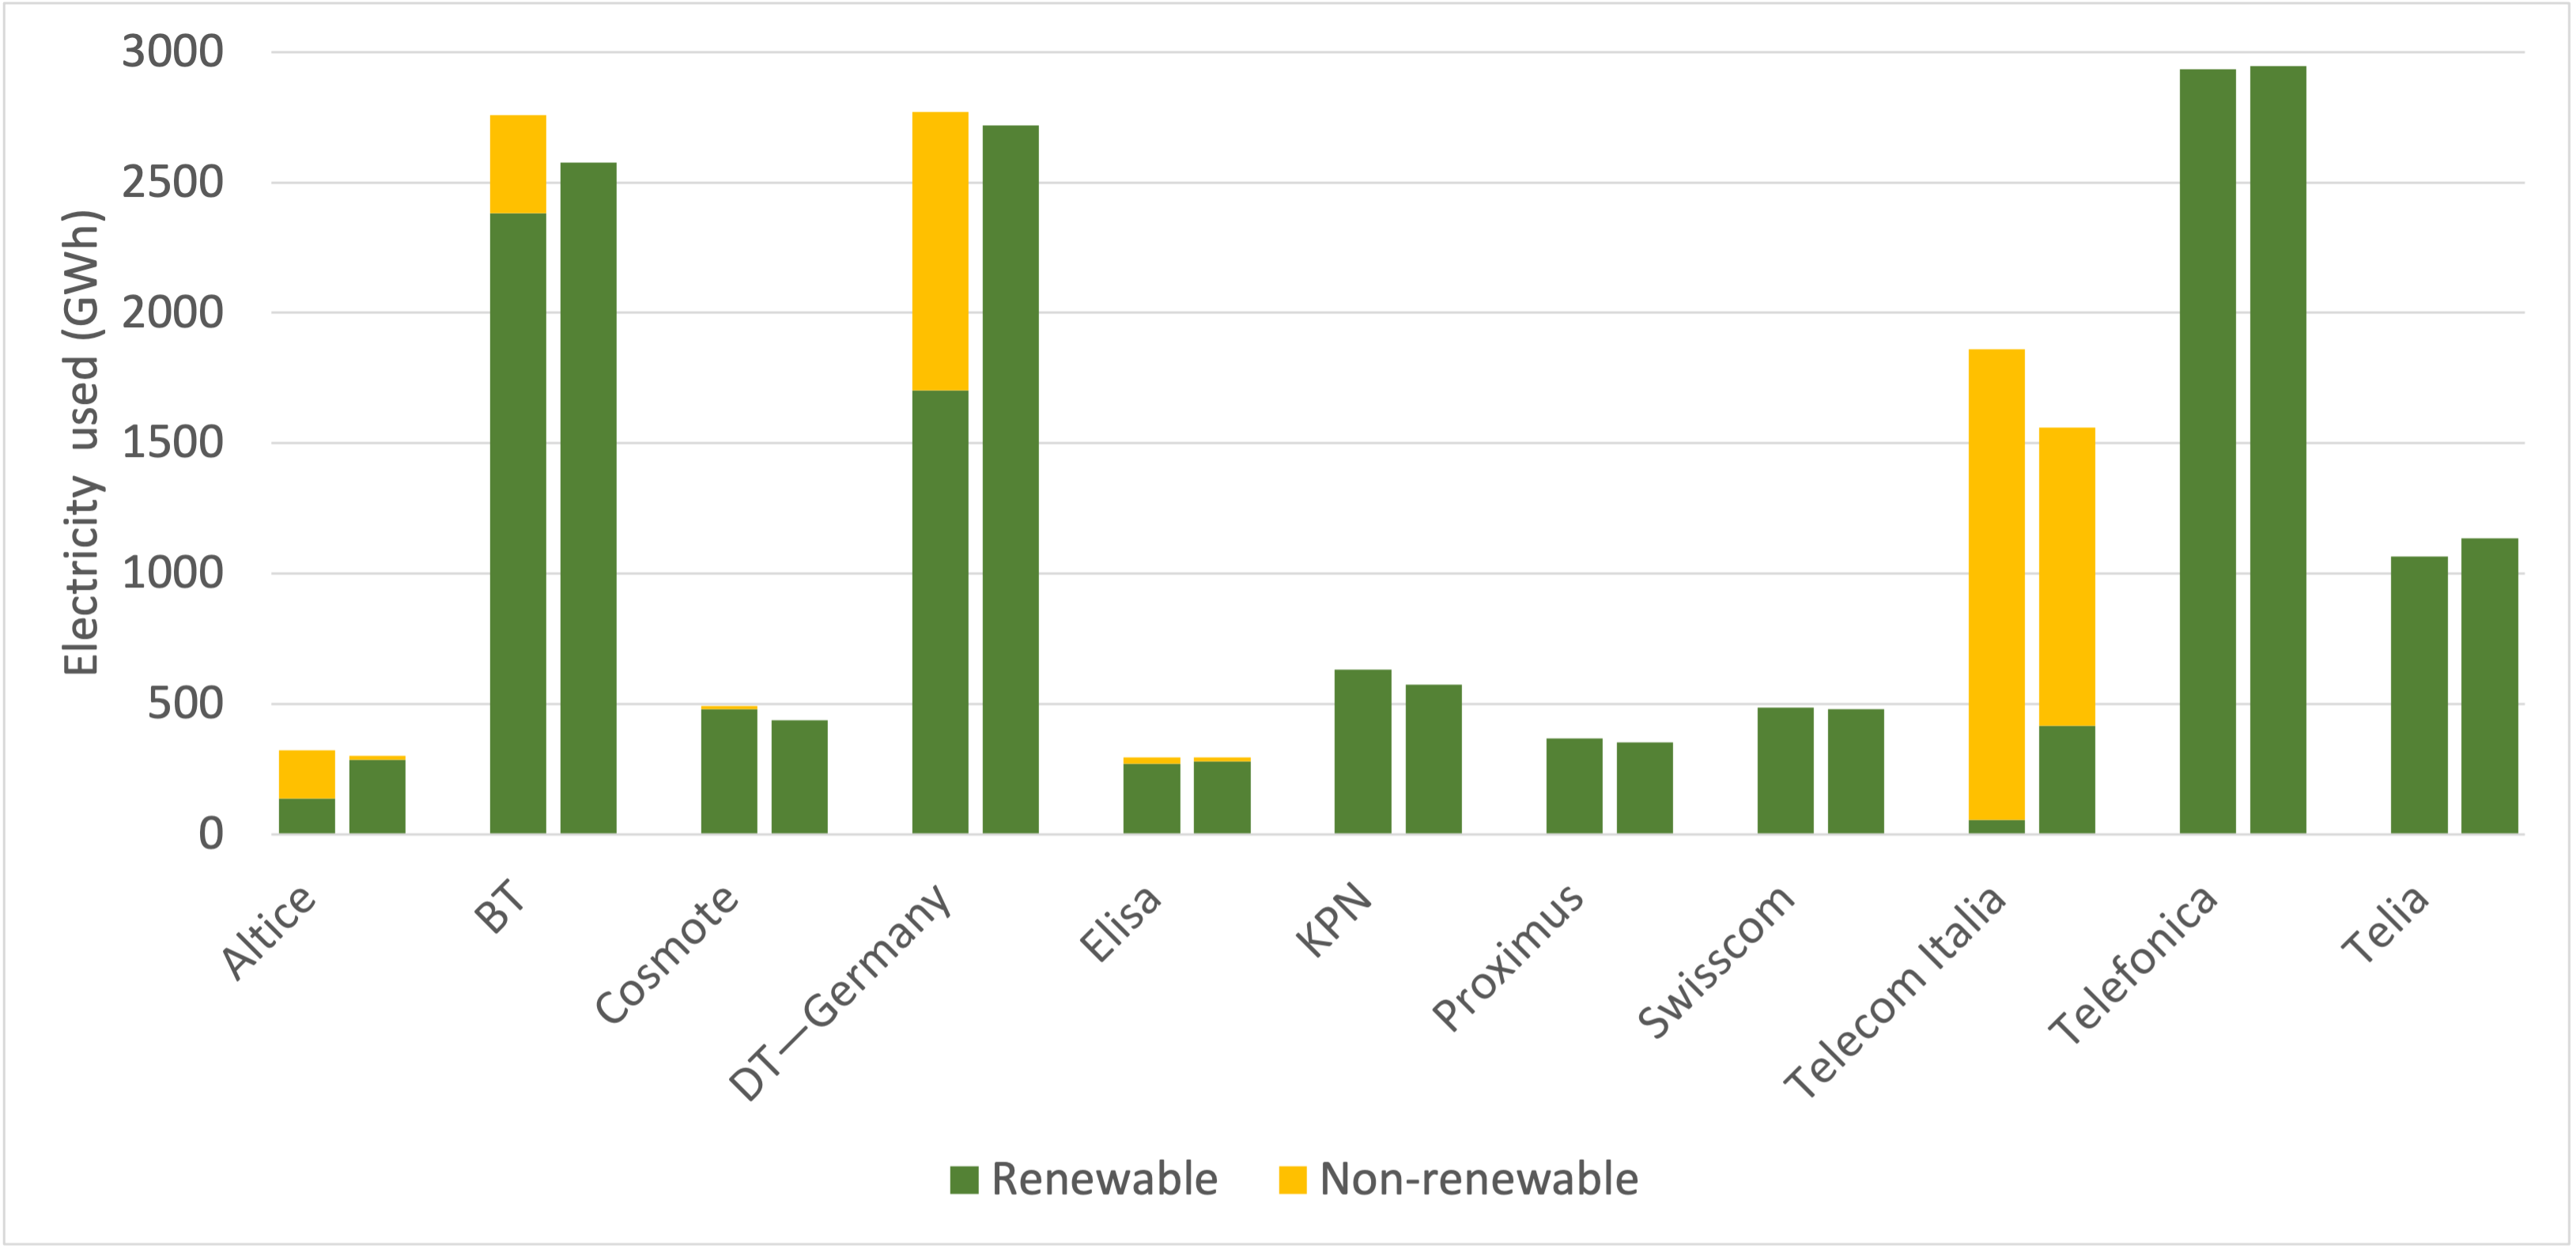
Although a data centre may have a relatively low carbon footprint, and the end user may have a 100% renewable energy contract with their supplier, neither has any control over the route that data may take between the data centre and the end user device. Many large European network operators have been introducing a larger proportion of renewable energy into their operations as shown in Fig. 6. Between 2018 and 2020, the majority of the companies in the dataset have virtually eliminated non-renewable electricity.
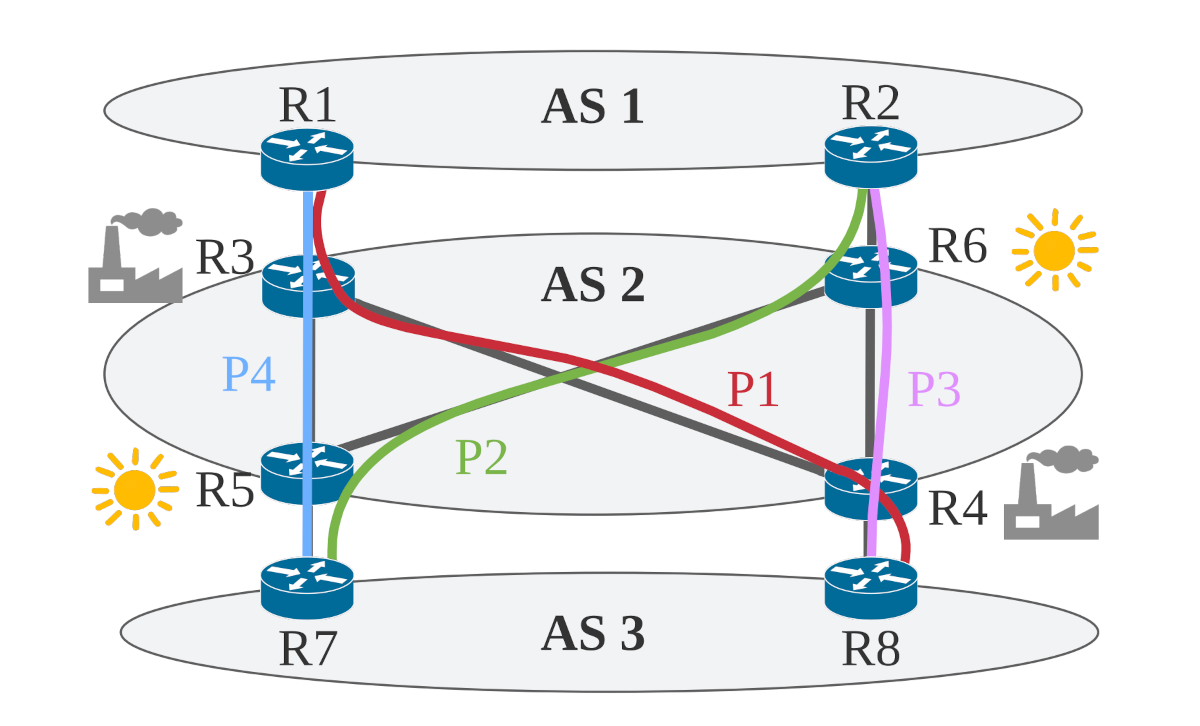
Although the outlook provided by Fig. 6 is a positive one, the carbon footprint of many networks is harder to assess because of a lack of data. Privately-owned networks and those in countries without mandatory reporting obligations will be primarily dependent on the energy mix in their local area. The uncertainty around the carbon footprint of telecommunications services has led some researchers to propose carbon-aware path selection for network routing equipment. Given a network topology like the one in Fig. 7, for examle, information about the power sources of the nodes would be made available to the routing algorithm. In the figure, three autonomous systems (AS) are connected in several ways. To route data between routers R1 and R2, some paths such as the one between routers R5 and R6 are powered entirely by renewable energy and would therefore be preferred over other options.
End-user carbon footprint
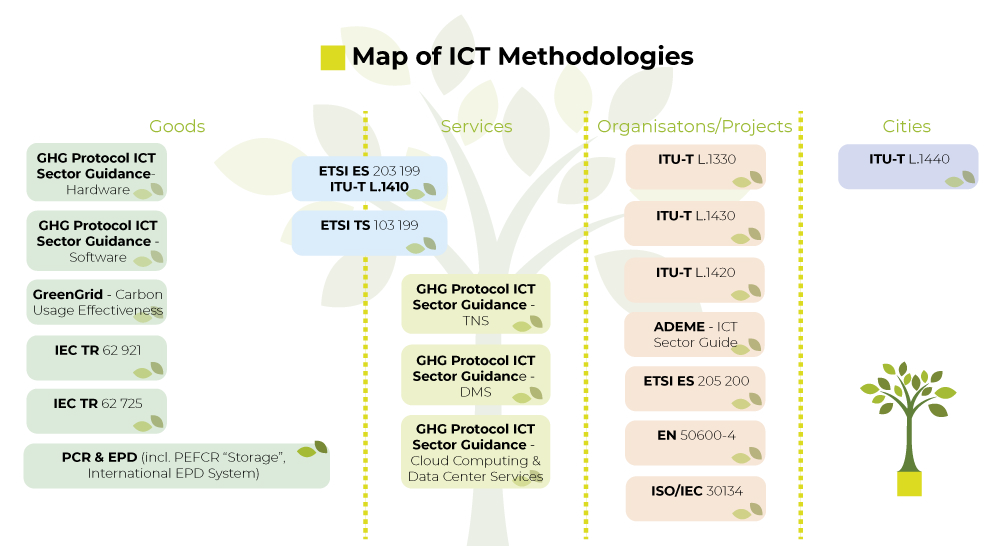
The ACT model discussed earlier is an example of an input-output model that attempts to map all of the inputs into a product or service. This approach relies on a lot of detailed information being available. A simpler approach is to use a coefficient model where a unit of activity is multiplied by a factor to give an estimated result (Giljum et al., 2013). Coefficient models are simpler to apply in practice and are therefore very common. Most of the online carbon footprint calculators available on the internet take this approach. The differences in results from one calculator to another are typically the result of the different coefficient values they use. Fig. 8 shows a map of official footprint methodologies that can be applied to computing activities.
Exercise: Personal internet footprint
In this exercise, you will use a simple coefficient model to evaluate the carbon footprint of your own internet activity.