Statistical tests
Statistical tests evaluate the probability that there is a large enough deviation from expected observations for it to be considered significant. Probability is expressed as a number from 0 to 1 where 0 corresponds to impossibility and 1 corresponds to certainty.
All statistical tests involve the calculation of a characteristic number or statistic with a known distribution. The simplest to work with is the normal distribution, and most tests assume that the data is normally distributed. If the data deviates from normal by a large amount, the test is no longer valid. With the normal distribution, most observed values will be close to the mean value. Because of natural variation, however, there will always be some extremely small or extremely large observed values. The extreme observations are found in the tails of the distribution as shown below.
| One tail | Two tails |
|---|---|
 |
 |
| One tail | Two tails |
In the diagram, the shaded area of the curve in the left-hand panel corresponds to the top 5% of values. That is, 95% of observed values are expected to be below the threshold value. To observe a value in the shaded area is rare, and is therefore more likely to be the result of a real difference rather than natural variation. A statistical test reports the probability of the calculated statistic occurring. If is below the critical value that corresponds to the 95% threshold, we say that we are 95% confident" that the observed difference is real, or more precisely, the result is significant at the 95% level*. For a greater degree of confidence, a 98% threshold is sometimes applied.
In the right-hand panel of the diagram, the shaded area is split between the two tails of the distribution, but still corresponds to the extreme 5% of expected values. When performing a test, you often have the option to perform a one-tailed or two-tailed test. A one-tailed test is appropriate if the direction of the difference is already known beforehand, and a two-tailed test is used if the difference could be in either direction.
Hypothesis testing
It is important to recognise that statistical tests are designed to identify results with low probability - that is, those that differ from the expectation. Because of this, the procedure is to assume that all differences are the result of natural variation, unless a test returns a statistic with an extremely low probability. In statistical terminology, the expected case where only natural variation plays a part is called the null hypothesis. The alternative hypothesis describes the low-probability situation where there is a mathematically significant result. For example, If we wanted to find out whether there is a significant difference in the number of social media contacts between make and female students, the null hypothesis would be that there is no significant difference, and the alternative hypothesis is the difference is significant. If our test returns a result below the critical value at the 95% level, we say that the null hypothesis is rejected and that the alternative hypothesis is accepted.
Variables
Any measured quantity is referred to as a variable in statistics. This could be a physical measurement like length, or an attitudinal concept such as dedication. Some tests are designed to evaluate the relationship between variables. Usually, this involves exploring whether one variable can be used to predict another. In such a case, the known quantity is called the independent variable, and the predicted quantity is called it dependent variable.
When setting up an experiment to measure the two quantities, it is important to exclude unwanted influences on the situation under test. For example, if you were trying to ascertain whether volume of network traffic could be used as a reliable predictor of the number of cyberattacks, it would be important to choose times when network traffic is not artificially raised such as immediately after a new software release or a noteworthy press release on the company website. These unwanted influences are known as confounding variables and need to be taken into account in the experimental design.
Test conditions
A common situation in an experimental study is to set up two contrasting situations to find out whether there is a significant difference between the two. For example, the purpose of the study might be to compare the usability of different search engines. To do that, you would need to gather a group of test subjects and ask them to carry out a prescribed set of search activities on each search engine. In experimental/statistical terminology, the test subjects are exposed to a set of different test conditions. In this example, a condition is defined by the search engine being used.
Degrees of freedom
Many tests are sensitive to the amount of data that is provided. The concept of degrees of freedom captures the idea that the more points there are in your dataset, the more possible combinations of values there are that need to be considered. Imagine a dataset of just one value: there is no variance because there is only a single fixed value. As soon as a second point is added, however, the difference between the two values is a source of variance. A third point introduces even more variance. Usually, degrees of freedom is equal to the number of data values minus one.
Choosing the right test
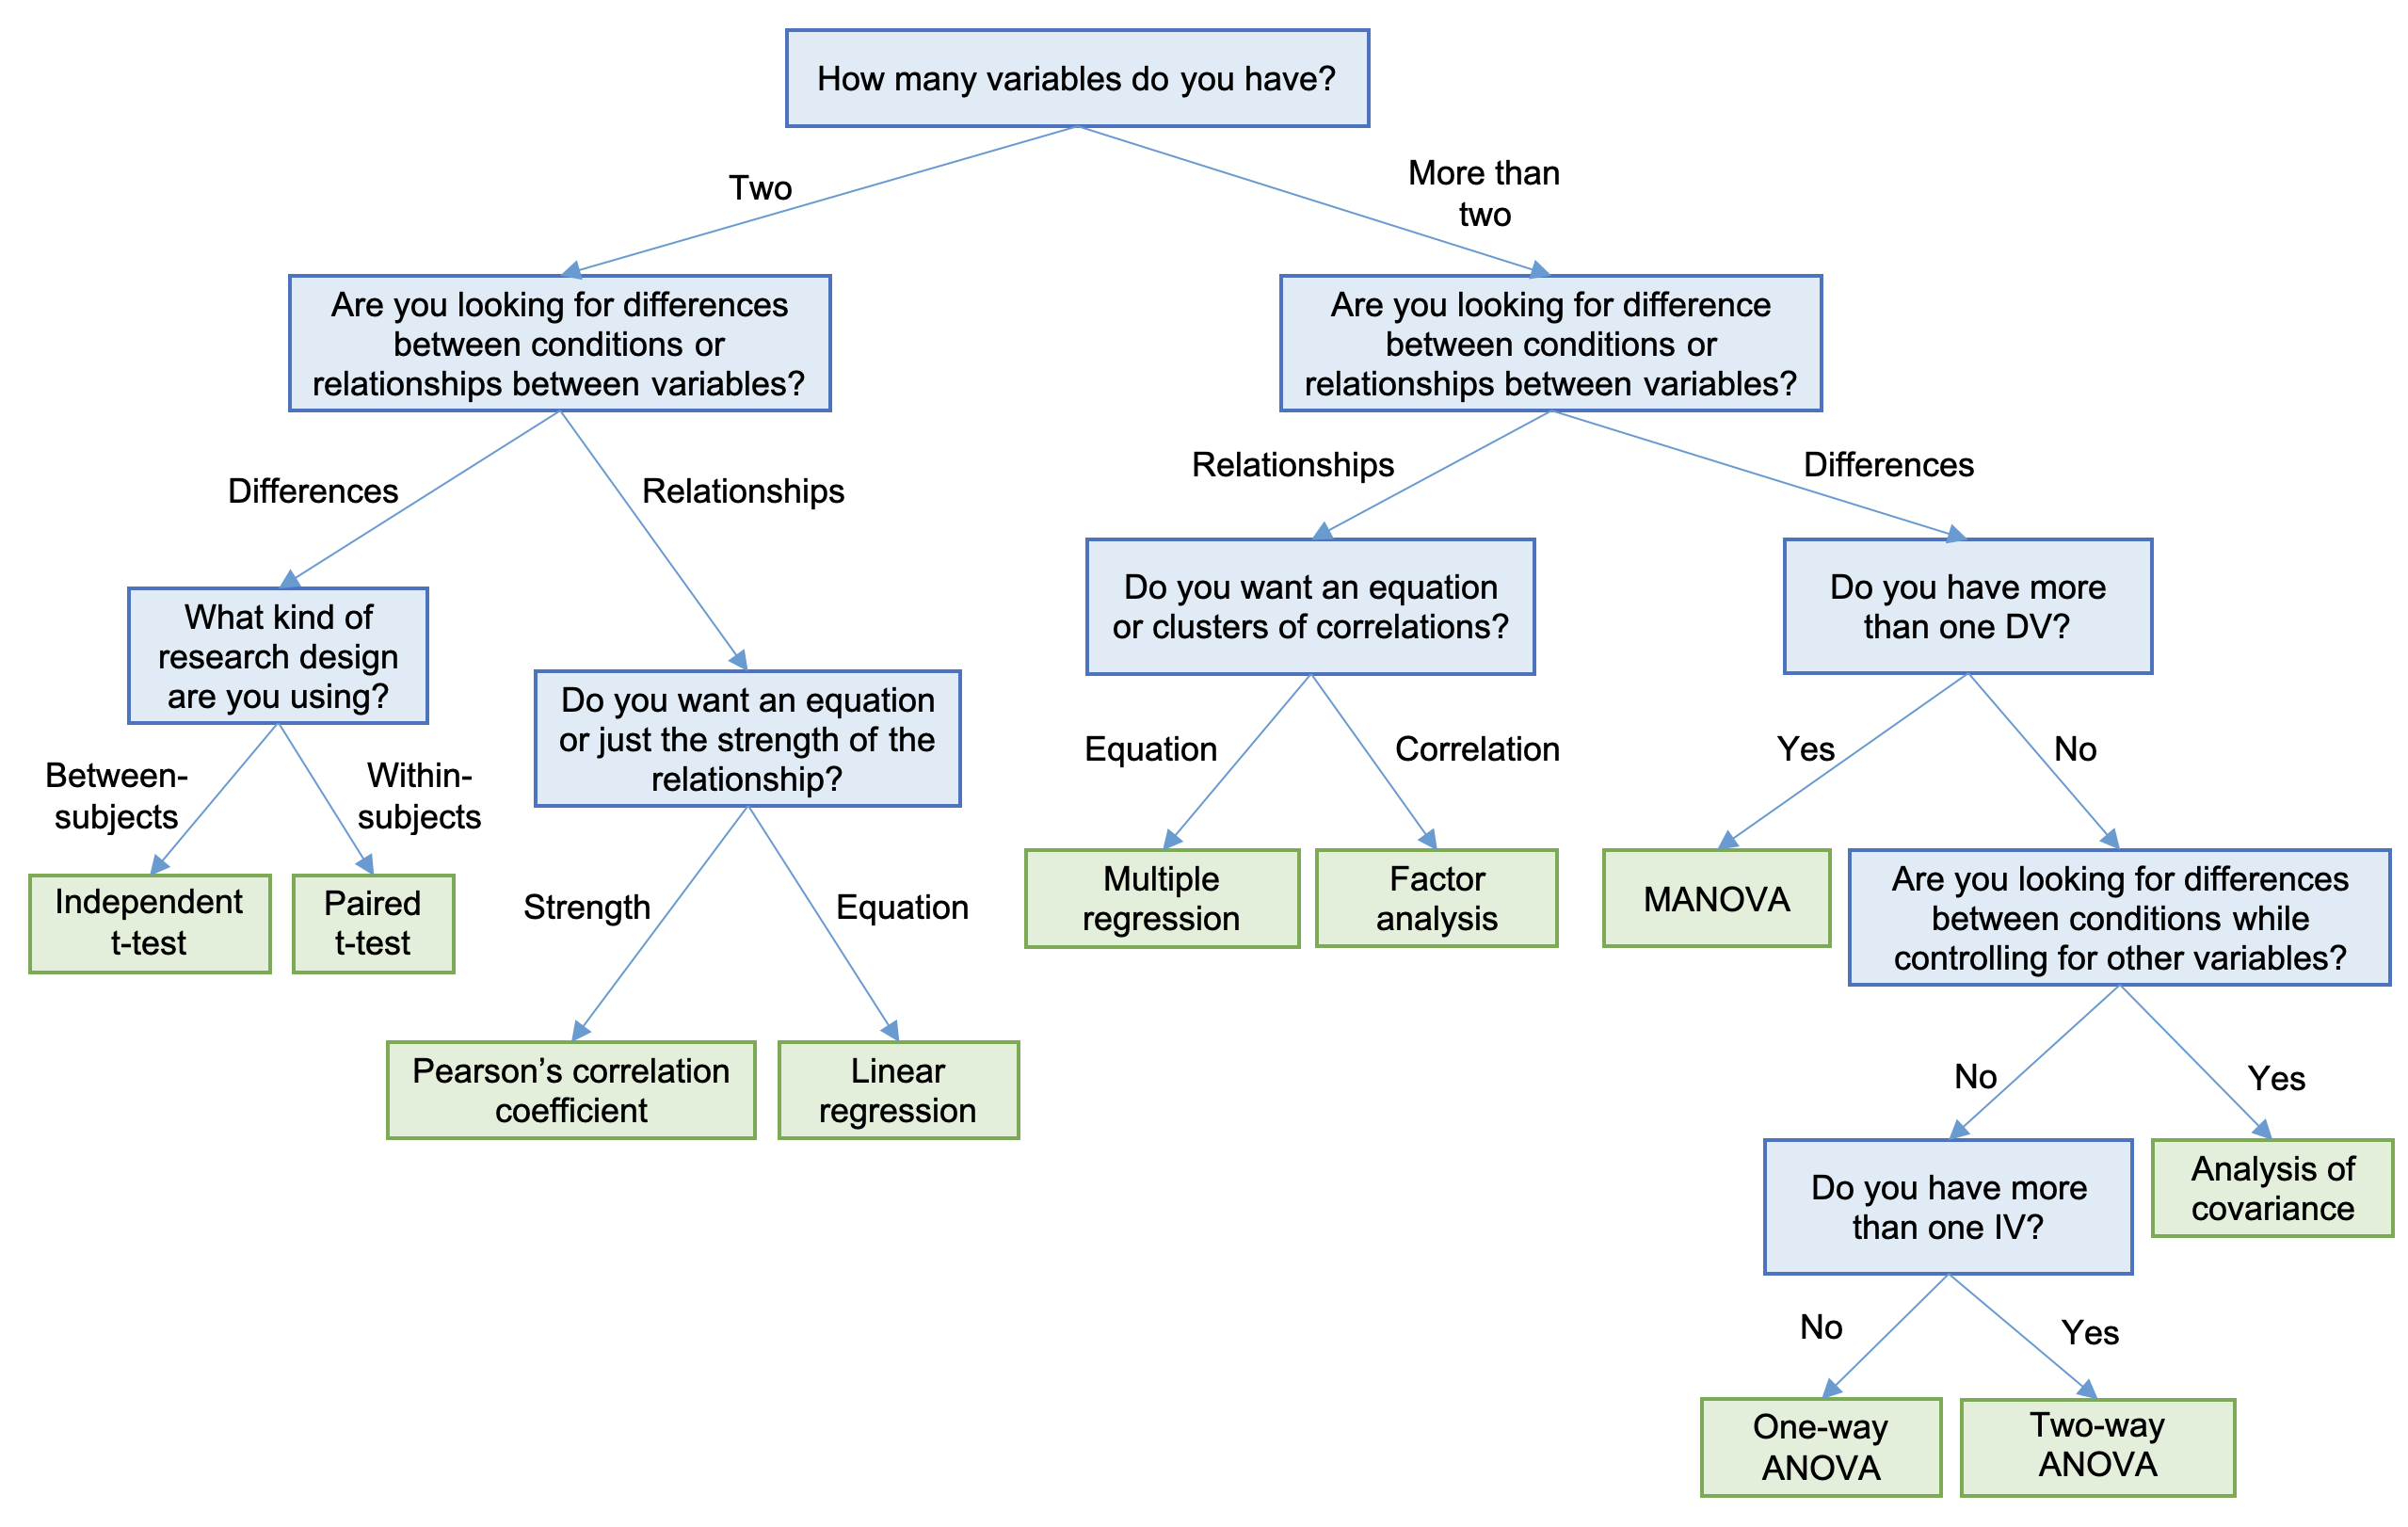
If you have a degree in applied mathematics, you will be able to select the test that is appropriate for the situation based on your theoretical knowledge. You might also carry out the test by implementing code based on the mathematical formula. Fortunately, there are several tools available for performing statistical tests that do not require deep mathematical knowledge. However, it is still important to know which test to use. The decision tree in Fig. 2 (Dancey, 2014, p. 158) helps with this by taking you through a series of simple questions.
Types of error
There are two major things that go wrong with statistical tests. Bearing in mind that statistical tests generally focus on accepting or rejecting the null hypothesis, the first type of error is when the null hypothesis is true but the test suggests it should be rejected. This is sometimes known as a false positive error, because when the null hypothesis is rejected, it results in accepting the alternative hypothesis. The second type of error is where the null hypothesis is actually false, but the test result suggests it should be accepted. This may be referred to as a false negative. Also known as Type I and Type II errors, these situations are illustrated in Fig. 3 (Photos by lingda kong and kelly newsom on Unsplash)

 Statistics without Maths