Threat modelling
A threat model documents the threats that have been identified in relation to a system. This allows the analyst to develop appropriate countermeasures.
The analytical process used to develop a threat model is shown in Figure 2. Note that the term asset refers to something of value that may be the target of an attack. Typically, this is the data that flows around the system rather than the component parts of the system itself.
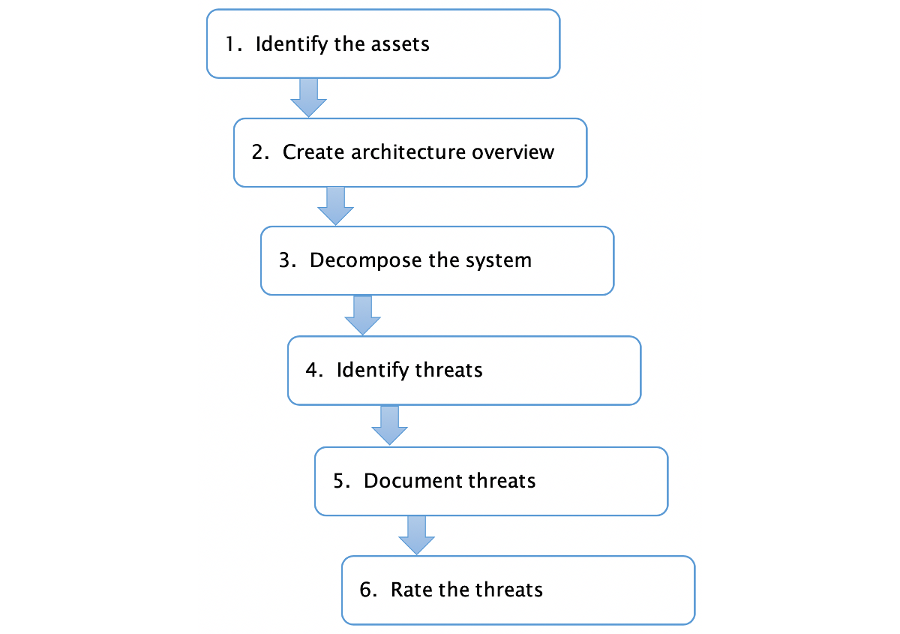 Figure 2: The threat modelling process (Russell & Van Duren, 2018)
The overview developed in step 2 identifies the major components of the system in schematic form. It refers to the actual devices and communications media involved.
In contrast, the representation of the system that is developed in step 3 is more abstract. The main focus is the flow of data through the system. In building up this version, the information from the first two steps comes together into a single data flow diagram.
Data flow diagrams have a long history in systems analysis. They are traditionally made up of four elements, external entities, processes, data stores and data flows but when being used for threat modelling, it is also important to represent the concept of a trust boundary. This is any place where data crosses some kind of interface where the source of the data is in any way uncertain. This might include, for example, data arriving over any kind of network link. These elements are summarised in the table below.
| Element | Description | Symbol |
|---|---|---|
| External entity | An external entity is a data source or sink outside the system. Sources will supply inputs into the system |  |
| Process | A functional part of the system which performs some sort of data processing. |  |
| Data store | A system element which stores data - for example, a database or configuration file. |  |
| Data flow | A uni- or bi-directional flow of data from one element to another. |  |
| Trust boundary | An interface between system elements where inoputs can not necessarily be trusted without some kind of validation or control. |  |
There are two rules to remember when building a data flow diagram:
- All data flows to or from a process
- A process must have at least one input and one output
Example
Figure 3 shows a threat model for an IoT-controlled traffic signal created using OWASP Threat Dragon.
Figure 4 shows the same system, but this time the diagram was created with draw.io. In the draw.io version, the assets, threats and countermeasure are presented in tables rather than being embedded into the diagram elements.
The system includes a camera to provide visual input at the signal device. The visual data is processed at the Mobile Edge Computing (MEC) node - probably a cell tower. Overall control is provided by a cloud application.
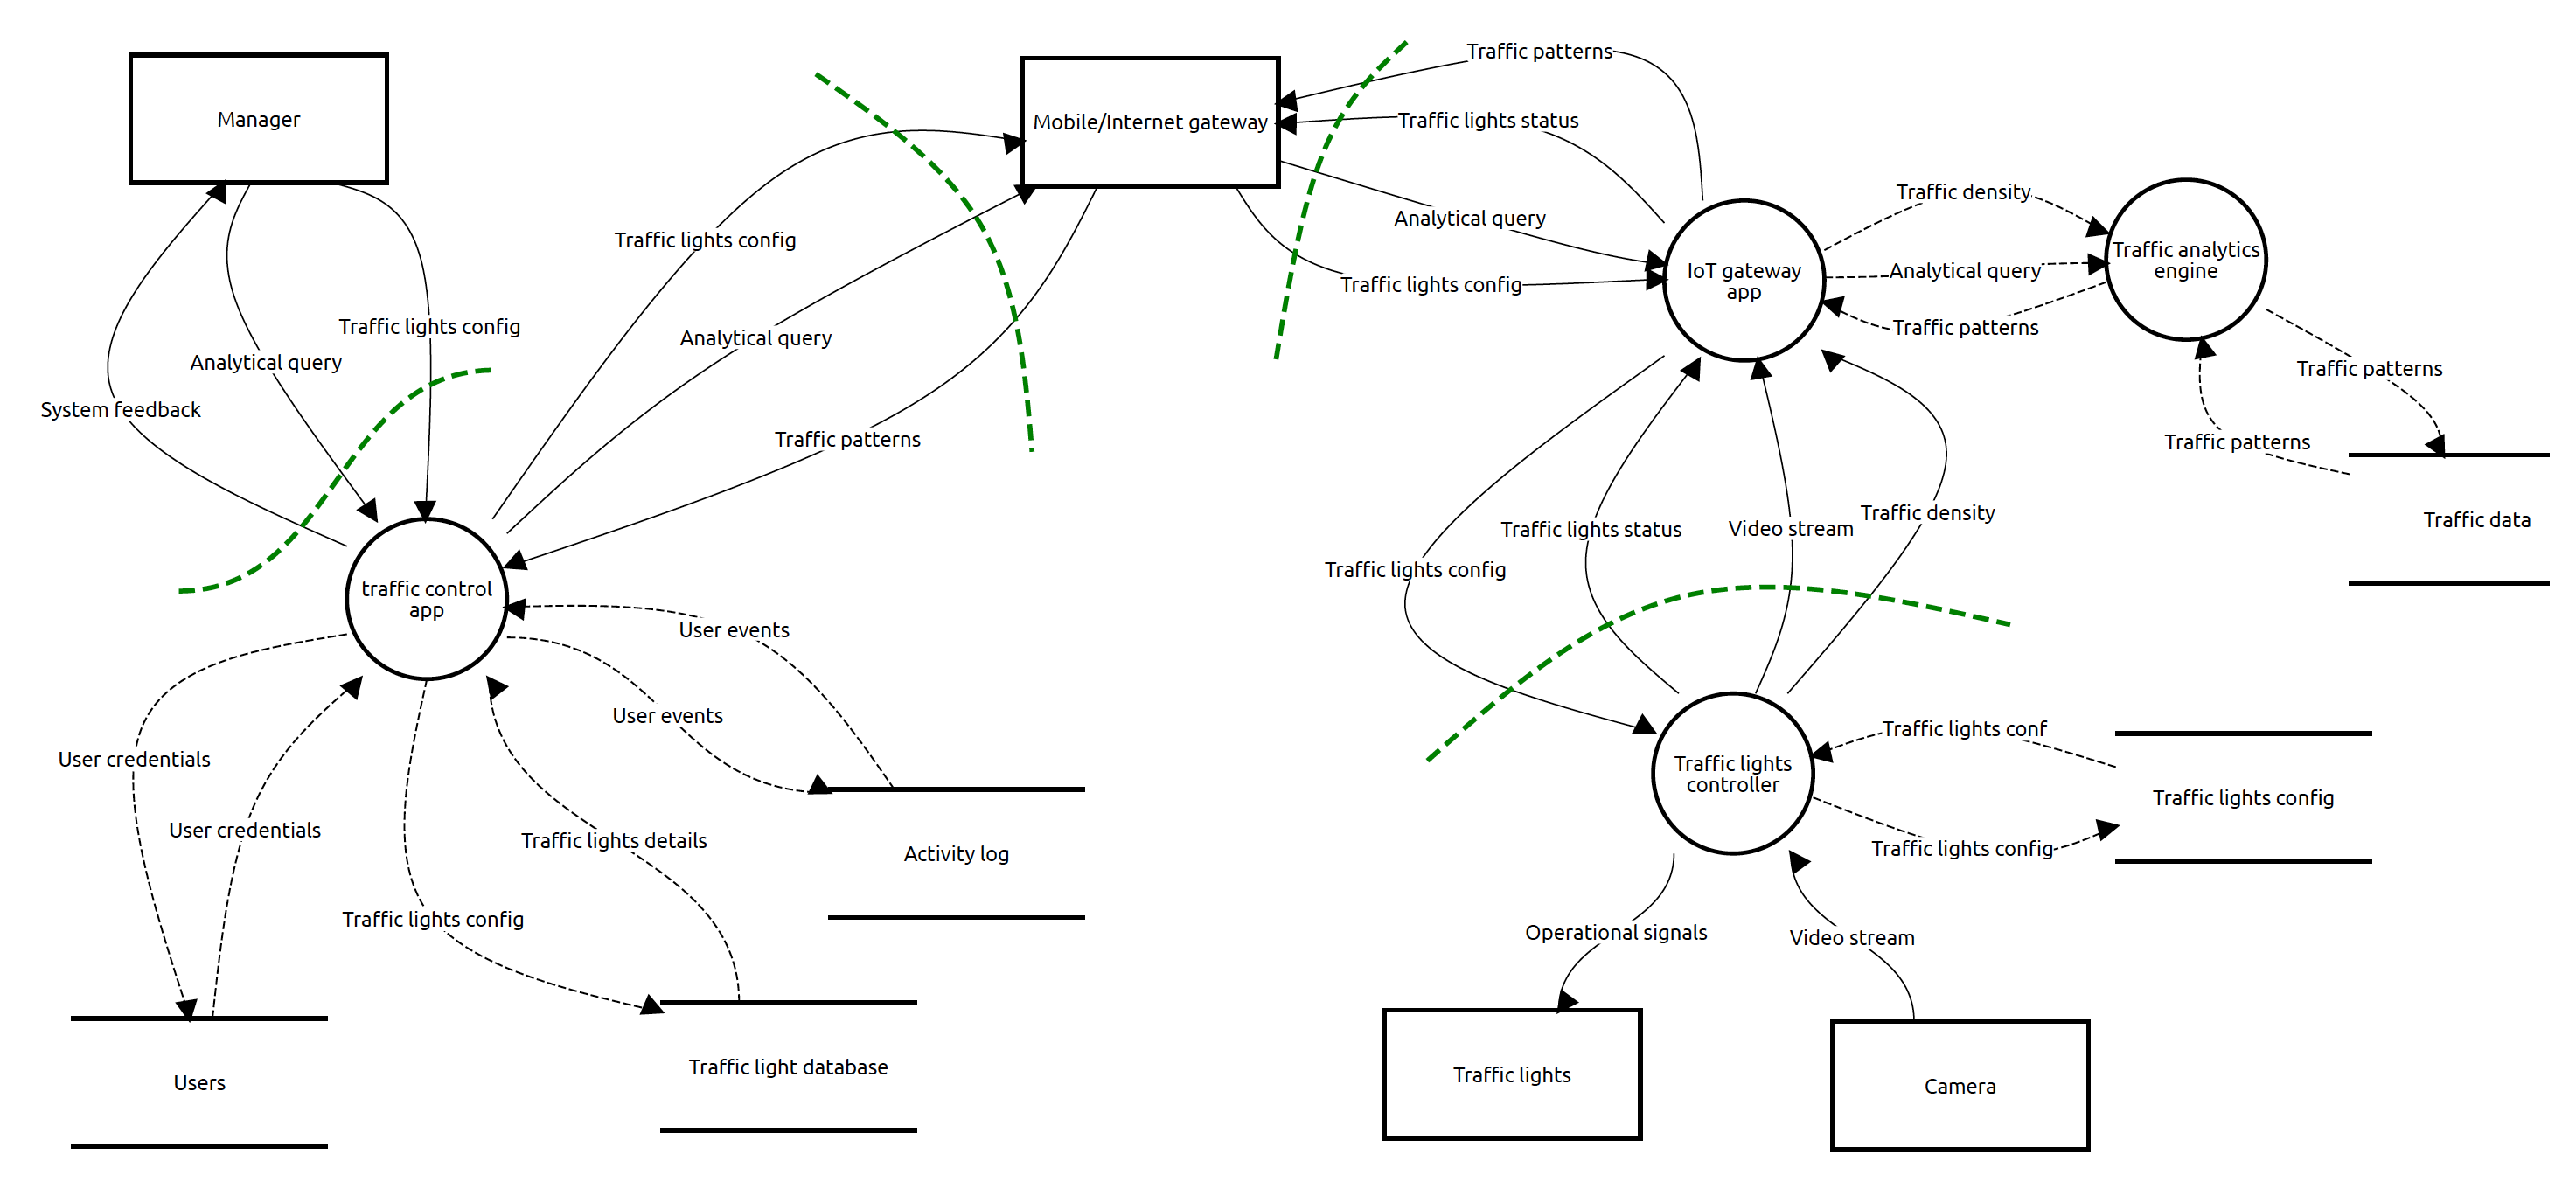 Figure 3: The threat model for an IoT-controlled traffic signal using Threat Dragon
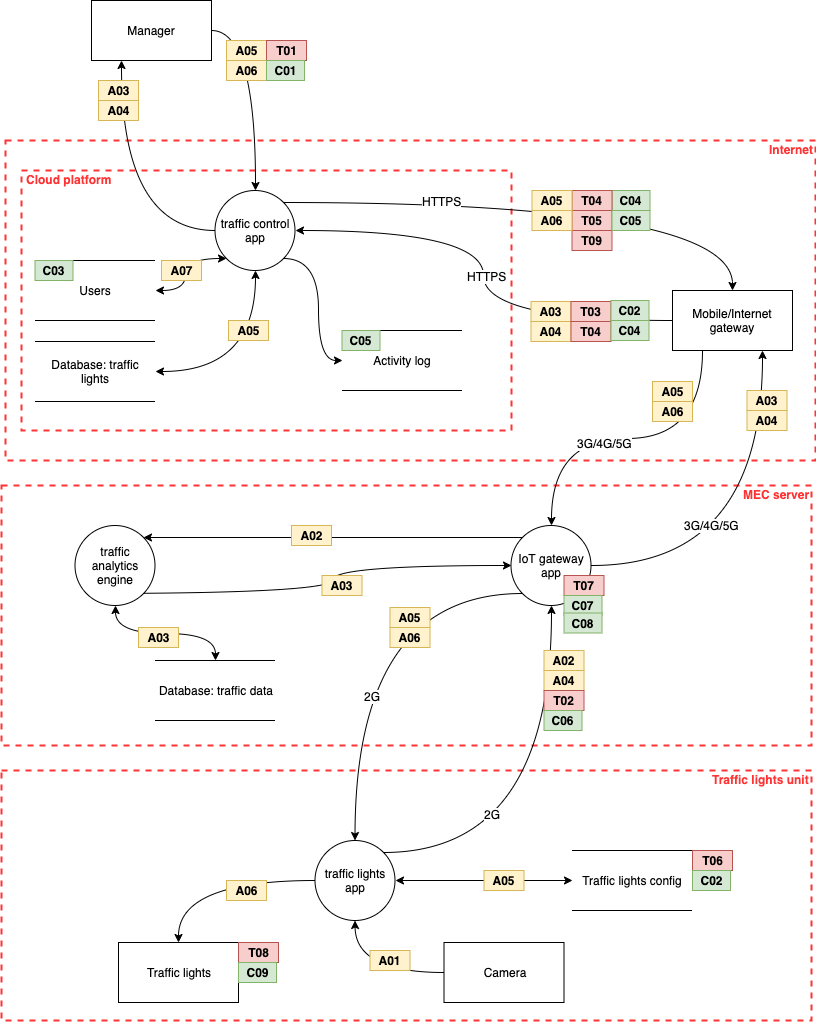 Figure 4: The threat model for an IoT-controlled traffic signal using draw.io
The diagram shows the flows of data between the various system elements. Where the flow passes between networks, there is a trust boundary.
The labels correspond to the assets, threats and controls shown in Figure 5.
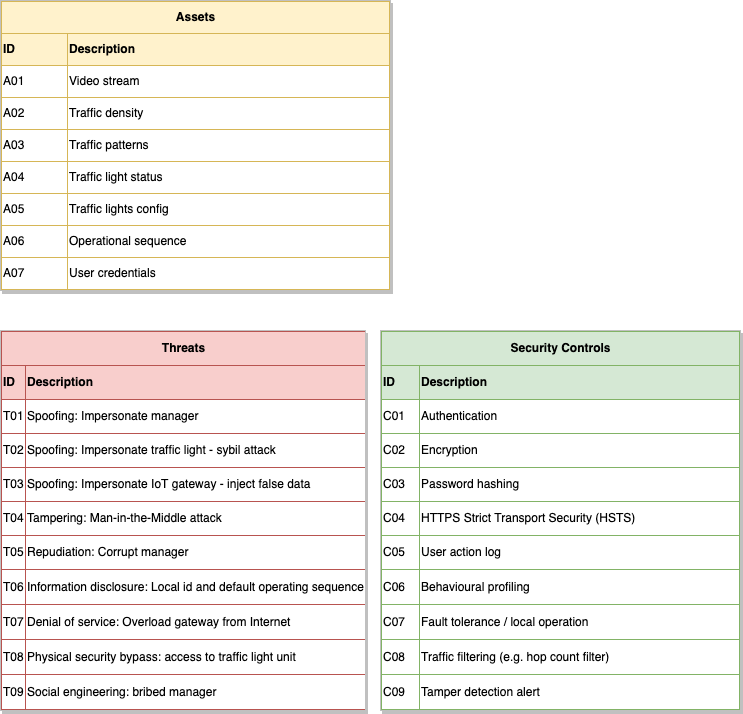 Figure 5: Assets, threats and controls
 Threat Dragon