HW-216 10 DoF IMU
 Figure 1: HW-612 combined IMU, temperature, pressure sensor
Hardware
The HW-612 (or GY-91) unit combines an MPU-9250 IMU and a BME280 temperature and pressure sensor. Both component sensors can be read using separate I2C addresses. The MPU-9250 has nine degrees of freedom (DoF):
- Linear acceleration along the x, y and z axes (accelerometer)
- Rotation around each of the x, y and z axes (gyroscope)
- Magnetic field strength along the x, y and z axes (magnetometer)
It also provides a temperature output, but it is not particularly accurate and is only used for internal compensation calculations. If you want a temperature reading you should use the one provided by the BME280.
As well as temperature, the BME280 gives the atmospheric pressure in Pascals and altitude in metres. Some compensation may need to be applied to the altitude reading in practical terms.
Because both of the component sensors use an I2C interface, connecting them up is very simple. Figure 2 shows how this is done.
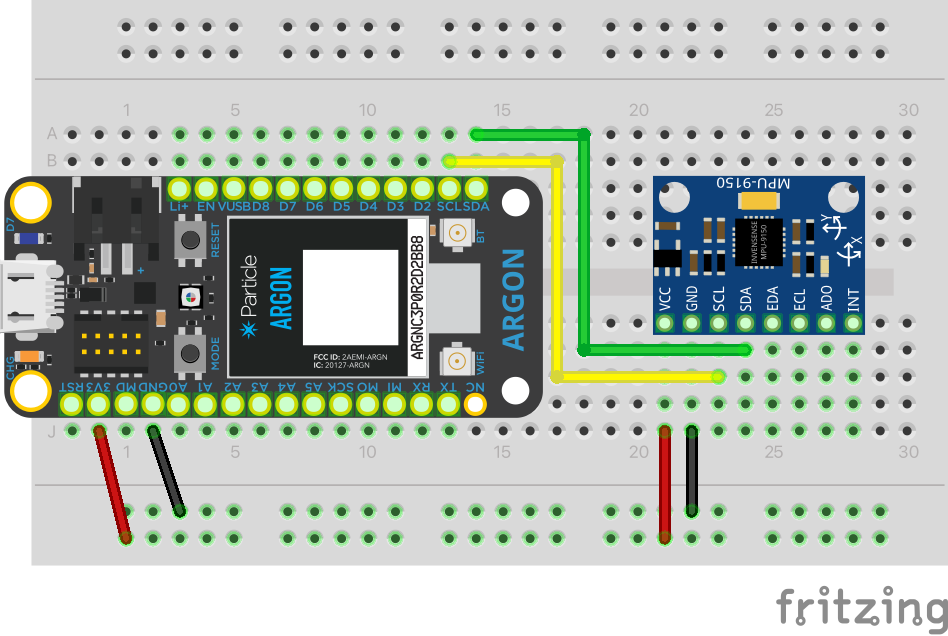
Figure 2: Breadboard layout
Please note that the unit shown in Figure 2 is actually an MPU-9150. The diagram is correct in the sense that it shows the I2C pins (SCL and SDA) connected as labelled. On the HW-612, the pins are in a slightly different order. Please double-check this on your unit before connecting it up.
Software
The Particle Web IDE provides example code for both the MPU-9250 and the BME280. For convenience, these have been combined and slightly simplified into a composite example that you can access via the Web IDE.
The example is configured to output sets of 13 data values to the serial monitor. Values are separated by commas, and each set is terminated by a newline character. The values are
| Field | Source | Code | Value |
|---|---|---|---|
| 1 | MPU-9250 | ax | acceleration along the x-axis |
| 2 | MPU-9250 | ay | acceleration along the y-axis |
| 3 | MPU-9250 | az | acceleration along the z-axis |
| 4 | MPU-9250 | gx | rotation around the x-axis |
| 5 | MPU-9250 | gy | rotation around the y-axis |
| 6 | MPU-9250 | gz | rotation around the z-axis |
| 7 | MPU-9250 | gx | magnetic field along the x-axis |
| 8 | MPU-9250 | gy | magnetic field along the y-axis |
| 9 | MPU-9250 | gz | magnetic field along the z-axis |
| 10 | MPU-9250 | mt | temperature |
| 11 | BME280 | bt | temperature |
| 12 | BME280 | p | pressure |
| 13 | BME280 | a | altitude |
If instead of these raw sensor values you would prefer a representation of the attitude of the unit in terms of yaw, pitch and roll relative to the Earth, there is a setting you can change in the code. The library code includes a complex algorithm for calculating these values which are known as an Attitude and Heading Reference System (AHRS). If you are interested in how that is done, the methods are explained here.
To change from the raw values to AHRS, you need to edit the code and change the value of the variable
at line 24 from false to true.
Displaying the data
As mentioned, the example code outputs the data to the serial monitor and you can view it by using the CLI command
1 | |
This will automatically detect the serial port that your Argon is connected to. However, with a lot of sensor data, it is often more useful to view it as a plot rather than a stream of numbers. This is especially true with IMU data because the changes are very difficult to spot in numerical form, but are very obvious in a graphical form.
Processing is a programming language/environment that is designed to
make graphical programming easy. You could design your own Processing application to display your
sensor data, but there are already some freely-available applications for you to use.
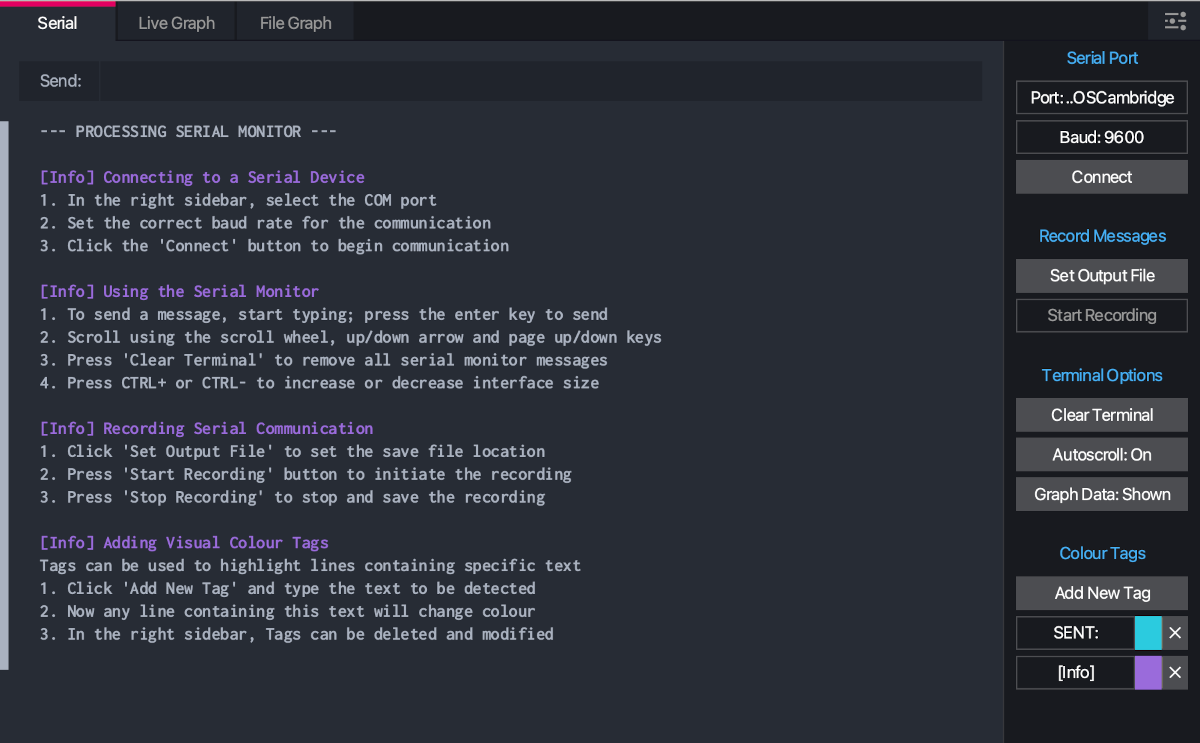
Processing Grapher is very easy to operate
gives you some good control over the input and the display. To run it, you will need to have
Processing installed. You can then open the executable programme (ProcessingGrapher.pde) with
Processing and run it using the standard menus.
Processing Grapher displays the raw serial output as well as creating plots, and so it can be a convenient alternative to the particle CLI. The one piece of information you will need in order to capture the output is the serial port that the Argon is connected to. An easy way to identify the correct port is to start the CLI serial monitor because it displays the port before it starts to log the data:
1 2 3 4 5 | |
You can then find the corresponding entry in the drop-down list in Processing Grapher at the top or the right-hand menu.